Market Views

Joe Zidle: Play the Hands the Markets Deal

September 30, 2022

By Joe Zidle

Tailwinds to growth are fading. Headline inflation may have peaked, but it’s sticky, and the Fed will “keep at it” to rein in prices.

September 30, 2022

By Joe Zidle

A former employer and mentor of mine once described his philosophy for portfolio management like this: Successful investors focus on making the best hand with the cards they’re dealt. The corollary to that statement is that too many people in the investment management industry—managers and forecasters alike—spend their time thinking about the way markets should be. It’s no surprise my former boss excels as a portfolio manager. One must be clear-eyed and dispassionate in order to analyze the cards that the market has dealt.
Today, I’m reminded of that lesson. Growth has been more resilient than many people expected. Healthy household balance sheets, combined with strong labor markets and growing corporate profits, largely fended off the challenges from inflation and central bank tightening. The longer runway to growth frustrated a vocal chorus of economic naysayers as they searched for evidence to prove the US was in a recession. The bad news bears of 2022 might eventually be right, but if so, they were also early.

This month, we share how our views are evolving, given what is likely to be a US economy in transition over the next several quarters. Tailwinds to growth are fading. Headline inflation may have peaked, but it’s sticky, and the Fed will “keep at it” to rein in prices. The next few quarters should reveal slowing demand and rising unemployment as we start to reach the end of the runway for this cycle. Recession risks in the US and global economies should not be underestimated. Volatility is elevated as conditions deteriorate, and bear markets in recessions historically last longer. For experienced investors with patient capital, market dislocations arrive freighted with opportunities to put money to work.

A Longer Half-Life To Inflation

If the first half of 2022 were a recession in the US, as many claimed, it will no doubt go down as one of the strangest in history. Despite two consecutive quarters of negative GDP growth—the layman’s definition of a recession—2.7 million new jobs were created, the labor force participation rate improved, continuing jobless claims fell by 20% and corporate profits surged to a record high. I doubt that the National Bureau of Economic Research (NBER) will deem it a real economic contraction. They use a broader set of criteria than GDP alone to determine the official start and end dates for a recession. In many respects, the economy strengthened even as headline GDP figures slowed.

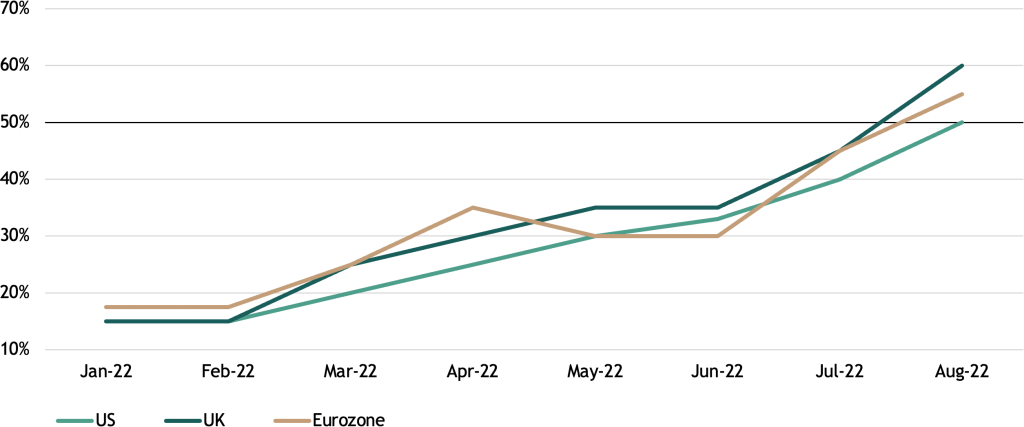
More challenging conditions abroad It’s my view that Europe will see a recession begin as early as the fourth quarter, and the UK is likely already entering recession. China’s growth also remains challenged, while the strong dollar is pressuring growth nearly everywhere else. The share of sovereign yield curves that are inverted around the world is the highest since the Global Financial Crisis, based on 10-year to 2-year sovereign spreads. 1 Spreads for most of the major credit default swap indices have also widened out significantly since the start of the year. 2 Clearly, headwinds are mounting, and they are reflected in falling growth forecasts and rising estimates of recession probabilities for the US, the UK and the Eurozone (see Figure 1).

Figure 1: Median Consensus Estimate of Recession Probability in the Next 12 Months 3
(YoY%)

Figure 1: Median Consensus Estimate of Recession Probability in the Next 12 Months
Headline inflation likely peaked in the US, but it’s sticky Inflation’s persistence has been another surprise for many observers. However, several encouraging signs from recent US CPI reports suggest that July marked the peak for headline inflation. We can now look past the volatile categories that hit fast and are rolling off quickly, such as energy. Even food, which rolled through more slowly and will take some time to decelerate, is a volatile category that we can assume will swing in the other direction eventually. There’s also observable deceleration in price growth in certain stickier categories. For example, we’ve likely seen the cycle peaks in home price appreciation and rent growth, which are still high but moderating.

Shelter prices hold a big key In the US, shelter inflation—which, like wages, tends to be quite sticky—may not drift down as rapidly as market prices. Shelter CPI lagged the market on the way up, and it very well might do so on the way down. Housing remains structurally undersupplied for the medium and long terms, and the pipeline for new home construction is dry. Rental housing markets are equally tight, with historically high occupancy levels. Simply put, the US needs more single and multifamily housing units, and until we get them, demand seems likely to remain higher than the supply.

This imbalance is important because shelter comprises around one-third of the overall CPI basket, and more than 40% of core CPI, which continues to accelerate. With this backdrop, the focus for investors is how quickly inflation falls and what the run rate will be. Here is where they must consider how continued labor market tightness may slow the decline.

Continued US labor market strength With more jobs added and initial jobless claims low and falling in recent weeks, tight labor markets continue to drive elevated wage growth. Average hourly earnings grew 5.2% year-over-year (YoY) in August, and the Atlanta Fed wage tracker, which measures median wage growth, rose at an annual rate of 6.7% in the most recent reading. 4 Also, Atlanta Fed and ADP data show that “job leavers” are commanding much higher wage growth than “job stayers.” This dynamic drives turnover and a race-to-the-top in worker pay, with job openings still at near-record levels and an elevated share of businesses reporting difficulty in attracting and retaining qualified labor.

Even with potential weakening in the labor market on a cyclical basis, there are reasons to think that it will remain tighter on a go-forward basis. While the US civilian labor force has recently returned to pre-COVID levels, it remains more than 4 million people below the pre-COVID trend at the same time that there are nearly 4.5 million more job openings relative to pre-COVID levels. 5 Even with further weakening in the labor market on a cyclical basis, the trends point to continued tightness on a more secular basis in the next cycle.

Shifting consumer demand may have Fed playing whack-a-mole Real incomes stagnated amid high price growth, but a peak in the inflation rate with wage growth still high may cause real incomes to increase. Retail sales in August showed that falling prices in some categories can free up wallet share to be spent in others. This scenario represents a phenomenon where supply / demand imbalances might roll through various categories until one or the other is brought into equilibrium. Until the unemployment rate increases and wage growth cools, the Fed could be playing a giant game of whack-a-mole with inflation. In this game, interest rates are a blunt cudgel. The most likely path is slowing economic growth and a longer half-life to inflation.

Continued Trouble for the Traditional 60/40 Portfolio
Markets remain too complacent. The efficient market hypothesis argues that all information is priced in. So with the S&P 500 and Nasdaq down more than 20% and 30%, respectively, from their trailing 52-week peaks, and the average company in each index down significantly more, an argument could be made that the market priced in the recession already. 6 But there is an apt quote, often misattributed to Mark Twain, that says, “It ain’t what you don’t know that gets you into trouble. It’s what you know for sure that just ain’t so.”

Record profit margins: Just ain’t so Stickier inflation, elevated wage growth and a higher cost of capital are all ingredients that place downward pressure on profit margins. In addition, a strong US dollar and a trend away from globalization are additional pressures for large multinational companies (like many of the constituents of the S&P 500) that have high shares of revenues from abroad and/or have highly globalized supply chains. Despite all of these headwinds, analysts continue to forecast record profit margins for the S&P 500 next year. Consensus expectations for margins have moderated somewhat in recent months, but their forecasts still point to profit margins that would be higher than at any point pre-COVID. Those forecasts are likely to be revised down even further in the coming months, along with those for earnings.

Earnings forecasts need to be revisited This bear market has the S&P 500 down to a 16x forward P/E multiple, but the drop is almost entirely due to price declines, as until quite recently, earnings forecasts remained elevated. But in every recession in the last 50 years, earnings growth declined by an average of around 10% from peak to trough. I am skeptical that earnings growth will remain positive, so I’m wary of the rosy profits forecast, and the 16x multiple. For comparison, markets historically trough at roughly a 13x multiple in recessions, on average.

A durable turnaround in global rates A forty-year trend of secularly falling interest rates has stalled, if not ended completely. Over that period, the average of global rates hit an all-time low. Today, short-term sovereign bond yields for G7 countries hover around an average of 2% (see Figure 2). We are in the midst of one of the most coordinated tightening cycles in recent memory, with approximately 85% of central banks currently hiking policy rates. Even so, rates are still low from an historical perspective, as the chart shows. The recent rise in interest rates, while rapid, has further to go. One reason for that is a secular trend of underinvestment.

Figure 2: Average of G7 Countries’ Short-Term Interest Rates 7
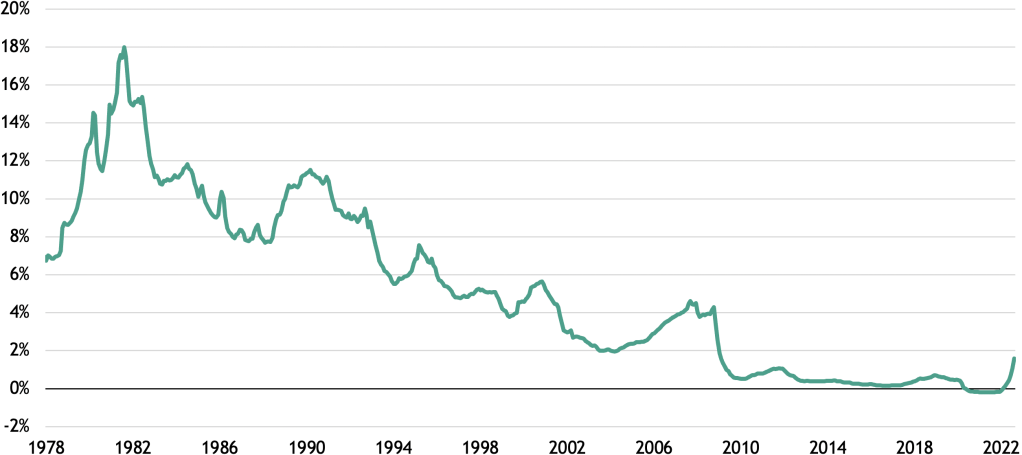
Figure 2: Average of G7 Countries’ Short-Term Interest Rates
Already-constrained supply meets boosted demand If one is to believe that inflation will be conquered and permanently return to ultra-low levels, then it would also be reasonable to assume that interest rates will return to record lows. However, as we discussed in our August essay, there are decades of underinvestment to contend with. Globalization enabled the US to rely on decades of cheap imports, while capital spending as a share of GDP declined in manufacturing. This was not problematic when excess slack in the economy never got used up, and US output never bumped up against potential growth. This underinvestment in supply was laid bare when the fiscal policy response to COVID suddenly boosted demand. In the US, that stimulus translated into a benefit of approximately $28,000 per capita. For comparison, the New Deal era produced a total benefit of $6,280 per capita in today’s dollars. 8

Higher rates for longer challenge traditional fixed income The Fed and other central banks will slow demand cyclically. However, as mentioned in the August essay, investment spending is sensitive to rising rates. That means that the current fight against inflation may well lead to further underinvestment in the short term. That could exacerbate shortages and subsequently lead to a resurgence in inflationary pressures after the economy starts to recover. The shortages going in could be the shortages coming out, particularly in areas like housing and energy supply. Because of this, central banks may not be keen to immediately cut rates to zero (or at least not for very long) to ward off slowing growth. I am of the view that traditional fixed income will continue to be challenged by higher interest rates as a result.

Bonds, even those with higher interest rates, will just be clipping coupons, the real value of which will be lower because of stickier inflation. For their part, equity investors will be structurally challenged to achieve the returns of the previous cycles due to higher interest rates and the reversal, at least in part, of the unprecedented balance sheet expansions of the major central banks.

Rethinking stock / bond correlations I do not believe that the recent trouble for 60/40 portfolios is a one-time aberration. When considering diversification, it’s important to remember that correlations are not static. They change over time, and they can remain positively or negatively correlated for long periods, especially in rising rate environments, as illustrated in Figure 3. As the chart illustrates, in the late 1970s and much of the 1980s, when rates were high and generally rising, the correlation was strongly positive for a sustained period.

Figure 3: Stock / Bond Correlation 9

(rolling 5-year)
Figure 3: Stock / Bond Correlation

Reconfiguring the diversification toolkit In my opinion, the US will not return to a low rate / low inflation environment in the short term, so today’s positive correlation could persist for some time. Within that framework, investors need to consider new tools for their toolkits so they can still maintain an edge in the pursuit of attractive risk-adjusted returns. Alternative assets are one such potential solution, as returns tend to be less correlated to traditional public market returns, and often have lower volatility. Figure 4 shows how certain alternative asset classes have exhibited strong historical risk-adjusted returns compared to several commonly owned public assets. We plan to write more in the coming weeks about alternative assets and the potential diversification benefits they can offer for certain portfolios.

Figure 4: Historical Risk and Return of Select Asset Classes (2017–2021) 10
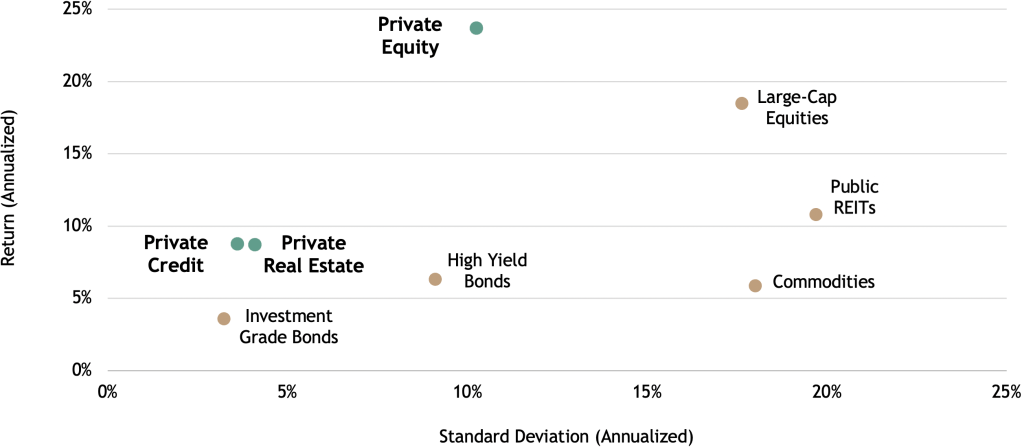
Figure 4: Historical Risk and Return of Select Asset Classes (2017–2021)

Themes and sectors for the long term—and our November essay Despite all the challenges, I expect a number of secular themes and sectors, particularly those tied to energy security and the global energy transition, to present exciting opportunities for investors. We will discuss these topics in much greater detail in next month’s essay, which I will co-author with Dr. Jean Rogers, Blackstone’s Global Head of ESG.

With data and analysis by Taylor Becker.

1. Blackstone Investment Strategy and Macrobond, as of 9/23/2022. Represents the 10-year to 2-year sovereign bond spread for 30 countries, daily observations beginning in 2005.
2. Bloomberg, as of 9/26/2022.
3. Blackstone Investment Strategy and Bloomberg, as of 8/31/2022.
4. Federal Reserve Bank of Atlanta, as of 8/31/2022.
5. Blackstone Investment Strategy and Bureau of Labor Statistics, as of 8/31/2022 (labor force levels) and 7/31/2022 (job openings). “Pre-COVID trend” represents the average growth in the labor force from 2015–2019, extrapolated out through today.
6. Equity index data sourced from Bloomberg, as of 9/26/2022.
7. Blackstone Investment Strategy and OECD, as of 8/31/2022. Short-term interest rates are generally averages of daily rates, measured as a percentage. Short-term interest rates are based on three-month money market rates where available. Note: Data availability varies for each country; data become available for five countries as of 1978 (the start of the time period in the chart). Data for the UK become available in 1986 and data for Japan become available in 2002.
8. St. Louis Fed, as of 7/13/2021.
9. Blackstone Investment Strategy calculations and Morningstar Direct, as of 8/27/2022. The stock/bond correlation represents the rolling 5-year average of the correlation between the S&P 500 Index and the Ibbotson Associates Long Treasuries Index. Weekly observations; each year assumed to comprise 50 weeks.
10. Morningstar as of 12/31/21. The returns and volatility of the asset classes presented are based on the following indices: Private Equity: Cambridge Assoc. US Private Equity Index, Hedge Funds: HFRI Fund Weighted Composite Index, Commodities: DJ Commodity Index, Investment Grade Bonds: Bloomberg US Aggregate Bond Index, Private Real Estate: NCREIF ODCE Index, High Yield: Bloomberg US Corporate High Yield Bond Index, Large Cap Equities: S&P 500 Index, Public REITs: MSCI US REIT Index. Investments in less liquid private market strategies are by nature risky and typically involve a high degree of leverage. The returns indicated above are long-term and represent well-known asset class indices and are not meant to be predictive of the performance of any particular fund, nor are they meant to suggest that all private funds result in positive returns or would avoid loss of principal.

The views expressed in this commentary are the personal views of Joe Zidle and do not necessarily reflect the views of Blackstone Inc. (together with its affiliates, “Blackstone”). The views expressed reflect the current views of Joe Zidle as of the date hereof, and neither Joe Zidle or Blackstone undertake any responsibility to advise you of any changes in the views expressed herein.

Blackstone and others associated with it may have positions in and effect transactions in securities of companies mentioned or indirectly referenced in this commentary and may also perform or seek to perform services for those companies. Blackstone and others associated with it may also offer strategies to third parties for compensation within those asset classes mentioned or described in this commentary. Investment concepts mentioned in this commentary may be unsuitable for investors depending on their specific investment objectives and financial position.

Tax considerations, margin requirements, commissions and other transaction costs may significantly affect the economic consequences of any transaction concepts referenced in this commentary and should be reviewed carefully with one’s investment and tax advisors. All information in this commentary is believed to be reliable as of the date on which this commentary was issued, and has been obtained from public sources believed to be reliable. No representation or warranty, either express or implied, is provided in relation to the accuracy or completeness of the information contained herein.

This commentary does not constitute an offer to sell any securities or the solicitation of an offer to purchase any securities. This commentary discusses broad market, industry or sector trends, or other general economic, market or political conditions and has not been provided in a fiduciary capacity under ERISA and should not be construed as research, investment advice, or any investment recommendation. Past performance is not necessarily indicative of future performance.

For more information about how Blackstone collects, uses, stores and processes your personal information, please see our Privacy Policy here: www.blackstone.com/privacy.

Related Articles