Portfolio Insights

Joe Zidle: On the Road Again

March 02, 2022

By Joe Zidle

There are secular themes unfolding that I think remain critical for investors to consider, regardless of the volatility that is likely to continue for some time.

March 02, 2022

By Joe Zidle

I wrote this month’s essay prior to Russia’s invasion of Ukraine, and I want to acknowledge the humanitarian tragedy that is unfolding. We are all watching in disbelief and urgently hope for resolution. This crisis has brought uncertainty for the economic outlook and for markets. Even so, there are secular themes unfolding that I think remain critical for investors to consider, regardless of the volatility that is likely to continue for some time. Accordingly, this month I wanted to provide an update on our framework for the expansion, as well as address some of the key themes that are coming up in many of my recent conversations. 

I wrote this month’s essay prior to Russia’s invasion of Ukraine, and I want to acknowledge the humanitarian tragedy that is unfolding. We are all watching in disbelief and urgently hope for resolution. This crisis has brought uncertainty for the economic outlook and for markets. Even so, there are secular themes unfolding that I think remain critical for investors to consider, regardless of the volatility that is likely to continue for some time. Accordingly, this month I wanted to provide an update on our framework for the expansion, as well as address some of the key themes that are coming up in many of my recent conversations. 

I wrote this month’s essay prior to Russia’s invasion of Ukraine, and I want to acknowledge the humanitarian tragedy that is unfolding. We are all watching in disbelief and urgently hope for resolution. This crisis has brought uncertainty for the economic outlook and for markets. Even so, there are secular themes unfolding that I think remain critical for investors to consider, regardless of the volatility that is likely to continue for some time. Accordingly, this month I wanted to provide an update on our framework for the expansion, as well as address some of the key themes that are coming up in many of my recent conversations. 

Our Framework: Bullish on the Economy

As Omicron loosens its grip on the US, it’s been nice to resume a more normal routine, including returning to the office full time and getting back on the road for business travel. Zoom is incredibly effective, but virtual meetings aren’t a perfect substitute for the real thing. I missed the spontaneous interactions with colleagues, from which some of our best and most creative ideas take seed. And I missed meeting with clients and our organic conversations, complete with a handshake, or at least a fist bump. 

Recently, I was fortunate to speak at conferences in Miami, Las Vegas and the Rockies, and to participate in smaller group and one-on-one client meetings. In this month’s essay, I highlight key points from those revealing discussions and focus on the aspects of the economy that raised the most questions; namely, equities, bonds, housing, and the economy’s debt burden against the backdrop of rising rates. I want to thank everyone who took time out of their schedules to meet. We are better when we are together and—finally—in person.

When Byron and I drafted this year’s Ten Surprises, we wanted to convey our optimism on the US economy while also acknowledging that market conditions would be more difficult. In our first Surprise, we wrote that earnings would collide with higher interest rates, resulting in greater volatility and a challenging outlook for forward returns across many asset classes. We expect economic growth to maintain strong momentum this year, but rising rates will challenge investors and policymakers alike. This theme underscores many of this year’s Surprises.

The fiscal response shouldn’t be underestimated  Our bullishness on the US economic outlook is based on the historic $6 trillion fiscal response to the pandemic. In effect, in just a matter of months, policymakers airdropped approximately 30% of 2019 GDP into the economy, roughly equivalent to the economies of California, Texas and Florida combined.1  We haven’t seen fiscal expansion like that since the New Deal Era nearly a century ago. As one result of an unprecedented coordination of fiscal and monetary policy, the Federal Reserve more than doubled the size of its balance sheet to nearly $9 trillion.2 Now, the economy faces the unintended consequences of this grand experiment, including inflationary pressures and supply chains overwhelmed by stimulated demand.

Deep pockets can mitigate recessionary risks  All the newly printed greenbacks won’t simply vanish. When the service side of the economy revs up, as we expect it will this year, consumer spending will get recycled again and again in the economy. This dynamic is largely in contrast to goods consumption, where spending is often exported to the lowest-cost producer globally. As spending shifts from goods to services, it will alleviate much of the “transitory” supply-side inflation evident in the economy. 

But, for every action, we should expect an equal and opposite reaction, and we are likely to see demand-side inflation pick up. We’re already seeing it in wages and rents. But this is the type of inflation that the Fed, by tightening monetary policy and dampening aggregate demand, is more able to affect. Despite the near-certainty of higher interest rates, I expect the padded wallets of US consumers, corporations, and state and local governments will create a virtuous cycle that proves to be enormously valuable in dampening recessionary risks. 

Duration risk the biggest challenge for investors  We also think the 10-year Treasury yield will rise to 2.75%. This Surprise remains significantly out of consensus. Yet the last time inflation was at 7.5%, the 10-year Treasury yield was at 14%.3 While it’s unlikely that we’re in a 1980s redux, history suggests that the current 10-year yield is not appropriate in today’s economic context. When the Fed ceases Treasury purchases and begins to reduce its balance sheet, I expect price discovery will return to markets. A higher, more realistic level in long-term rates is likely to ensue. 

I think this dynamic is the biggest challenge that investors face right now when they think about asset allocation. Higher long-term rates equate to duration risk—which isn’t limited to fixed income. Virtually every asset in a portfolio, equities included, has some sensitivity to increases in interest rates, which is the basic definition of duration. Managing this duration risk will be critical. Allocators of capital must consider many paradigms when they build a portfolio. But in this rising rate environment, I believe one of the most important things they should do is to evaluate every holding through the lens of whether it can hedge against or benefit from a higher 10-year Treasury yield. 

As the threat of higher rates settles in, questions about equity market performance, risks to traditional bonds, housing and the economy’s debt burden have dominated my recent conversations with clients. And I expect that they will continue to do so throughout 2022. 

Equities: Duration Matters

The concept of equity duration is not straightforward. There is no universal standard for calculating it as there is for bond duration. Bonds have fixed end dates and predictable income streams, which makes it easy to calculate how rising interest rates will impact a given bond’s price. Nevertheless, equities have interest rate sensitivity. 

Defining longer-duration  In my view, a company whose cash flows are weighted toward the distant future should be considered a longer-duration asset, compared to a business with current, stable cash flow generation. When interest rates were at zero, and deeply negative on a real basis, there was little-to-no cost, save for opportunity, in waiting for that far-off cash flow to arrive. However, as interest rates started to rise last year, long-duration equities began underperforming. 

For example, SPACs were the proverbial canary in the coal mine. Many pre-earning companies, and even some pre-revenue ones, found their way to public markets via these vehicles. In the 12-month period ending February 18, 2022, these long-duration stocks had dropped an average of more than 40%.4

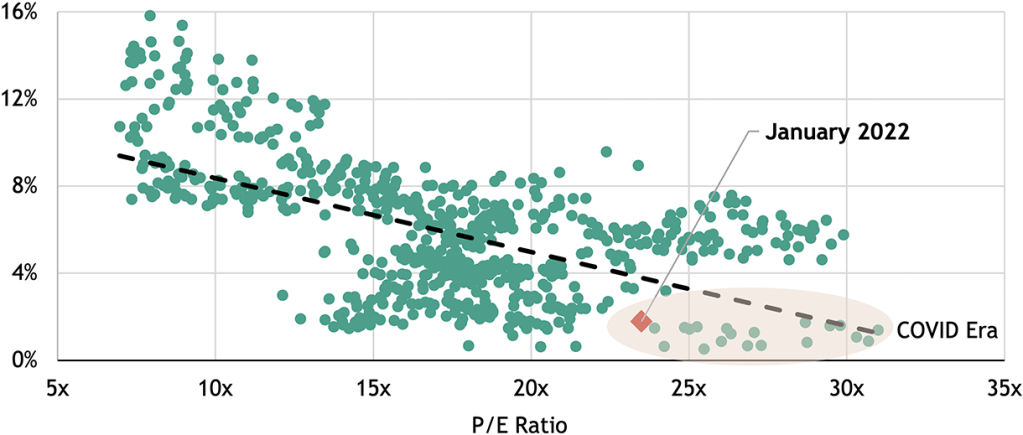
Also, I’m not surprised initial public offerings and high-flying tech stocks have underperformed recently. I expect that they will continue to do so for some time. What these investments have in common is high multiples. All else equal, a company with a high price-to-earnings ratio has more interest rate risk than a company with a low P/E ratio. Figure 1 below highlights the tension between interest rates and multiples. Outside of the tech bubble of 1999/2000, higher interest rates don’t support high multiples. 

Figure 1: 10-Year Treasury Yields and S&P 500 P/E Multiples
10Y Treasury Yield


Source: Blackstone Investment Strategy calculations, Federal Reserve and Bloomberg, as of 1/31/22.

Appetite for cyclicals likely to increase  I expect a continued rotation away from companies and industries with more duration risk and toward more cyclical parts of the market. The elements of an equity portfolio—public or private—that depend on market beta for returns will be under sustained pressure as operating conditions become more challenging. 

Traditional Bonds: Return-Free Risk

In a 2021 TV interview, I heard famed investor and philanthropist Leon Cooperman describe traditional fixed income as “return-free risk.” I’d be hard-pressed to find a more apt description of the dynamic that many investors faced as they extended their maturities at ever-lower coupons in search of scarce yield. 

A long waiting game  The impulse to take on long-duration exposure was understandable, as a decades-long backdrop of low inflation and even lower interest rates made income hard to come by. It’s left retail investors heavily exposed to traditional fixed income. US mutual funds and individuals hold $3 trillion in municipal bonds, while taxable bond mutual funds and ETFs with strategies focused on traditional fixed income have net assets of over $5 trillion.5 We must consider the risk to those securities: Currently, the average maturity and option-adjusted duration of the Bloomberg US Aggregate Bond Index are at 8.7 years and 6.6 years, respectively.6

One of my favorite examples of an extreme version of duration risk is the 100-year Austrian sovereign bond. It is down 37% year to date and 49% from its high. With a coupon of 2.1%, it would take an investor who invested at the peak approximately 34 years to recover from the loss.7

Dynamic debt instruments key  I view certain non-traditional forms of fixed income as relative safe havens in this environment, such as floating-rate securities. Owning an instrument that can reset interest rates higher in response to the changing landscape will be critical to protecting principal and purchasing power. Private credit that is senior in the capital structure can also be attractive, given the more differentiated outcomes that I expect in business performance. As tougher operating conditions set in, investors should also consider which sectors of credit markets to weight more heavily. Certain industries benefit from secular tailwinds and are likely to continue to do so, such as those focused on digital commerce, data management, housing and diversified consumer spending. In addition, companies with pricing power would be expected to have an operational advantage in an environment of elevated inflation and rising rates. 

Housing: It’s Jobs, Not Interest Rates

The 30-year mortgage rate recently spiked to nearly 4%, and following a record 119 consecutive months of year-over-year home price gains, concerns are growing about whether affordability will become a major concern for housing markets. However, my view is that housing fundamentals remain strong. 

Multiple factors dictate the housing cycle  Housing isn’t a two-dimensional relationship between prices and mortgage rates. While higher rates historically correspond with slower sales activity, the data also indicate that activity generally bounces back and pricing remains relatively stable when these higher rates occur outside of recessions.8 Factors such as housing supply, labor market strength and, perhaps most importantly, income growth, all play critical roles in the housing cycle. 

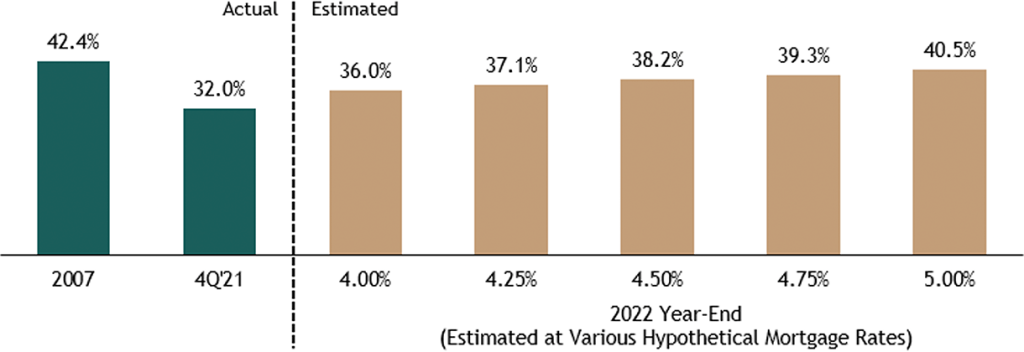
Figure 2 below illustrates how despite a record high median home sale price of $408,100, and a 30-year mortgage rate at its highest level since the pandemic began, mortgage payment affordability remains well below levels seen in the last housing boom.9 Our analysis shows that, assuming various levels of interest rates and consensus forecasts for home price appreciation and earnings growth, mortgage rates could climb as high as 5%, which would be higher than most currently expect. Also, homeowners would still be within the record level of mortgage payments-to-income ratio that was set in 2007. 

Figure 2: Mortgage Affordability: Actual and Estimated at Various Hypothetical Mortgage Rates
(Ratio of Monthly Mortgage Payment to Monthly Personal Earnings)


Source: Blackstone Investment Strategy calculations of BLS, Census, HUD and Freddie Mac data. Ratio calculated using average 30-year fixed mortgage rate, median sales price of U.S. homes, and a proxy for average monthly personal earnings. Estimates assume consensus forecasts for home price / earnings growth.

Rising incomes can mitigate mortgage rate effects  Based on 4Q21 median home sale prices and mortgage rates, and assuming a homebuyer puts 20% down, the monthly mortgage payment works out to $1,390 on average, or 32% of average monthly income. That’s an increase of nearly $200 since 4Q19. However, monthly personal earnings are nearly $450 higher now. Home prices are up around 30%, but the increase in income has kept pace. That’s why average mortgage affordability barely nudged, rising from 31% in 4Q19 to 32% last quarter. 

A key to our recovery outlook is residential construction, which has a tremendous economic multiplier effect, one of the highest of any kind of economic activity. Every dollar spent on residential construction outlays is estimated to increase GDP by $3.08 and personal income by $1.08.10 There is also a significant jobs multiplier effect, as every $1 million in direct outlays related to residential construction is estimated to support just under 22 jobs, according to 2019 data. As I wrote in my essay last August, I expect that the tailwinds of both household formation and demographics will continue to encourage strong demand for many kinds of housing. A strong housing cycle can go a long way toward sustaining a robust economic cycle, and vice versa.

Debt: Burdened by a Higher Purpose

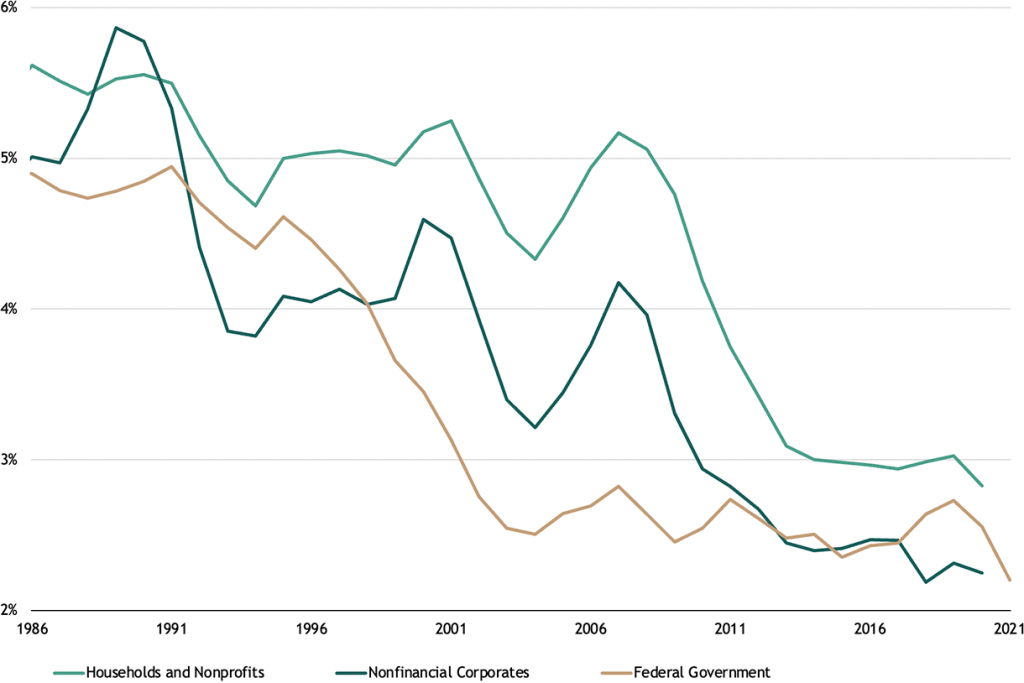
Federal debt in the US spiked to nearly $30 trillion following COVID-related stimulus. And yet, falling interest rates ensured that this increase resulted in but a trivial increase in the nation’s debt service (see Figure 3).11 Even so, the US is a highly leveraged economy today. Perhaps four decades of secular decline in interest rates make the nation immune to the idea, but higher rates will likely result in higher debt service. 

The US government’s average interest rate for all interest-bearing debt was roughly 1.5% as of January 2022.12 If that rate increases by 100 basis points, it implies a roughly $300 billion increase in the interest expense. That’s no trivial amount, considering that the US collected $2 trillion in individual income taxes in 2021.13

Figure 3: Debt Service, Share of GDP


Source: Blackstone Investment Strategy calculations, Federal Reserve and Bureau of Economic Analysis. Household and corporate data as of 12/31/20, federal government data as of 12/31/21.

A rolling loan collects no loss  As the US government’s debt payments increase and potentially become a focal point, policymakers will face some tough choices. Raising new taxes to cover the increased debt service will not be a popular option. The same goes for spending cuts. We believe that leaves policymakers with two options: hope or Modern Monetary Theory (MMT).  

Byron and I wrote about MMT in our Ten Surprises of 2021, though it was not an endorsement. We did not wade into the discussion of MMT’s merits, but we did think that policymakers would embrace it. And while the price must eventually be paid, the government does have the privilege of terming out its debt. Just as “a rolling stone collects no moss,” so “a rolling loan collects no loss.” It’s something that is on my mind as the nation’s debt burden continues to climb. 

Of course, the US has the exorbitant privilege of being able to print its way out of troublesome interest payments, and the Fed could commit to buying the long end of the curve even as it shrinks its balance sheet. Such an operation wouldn’t be so different from the Fed’s “Operation Twist” in the early 2010s, or Japan’s explicit yield curve controls. Whether policymakers make the difficult choice to rein in the deficit or revert to more “easy money” ways to inflate its way out, remains to be seen, but it will likely be one of the more significant decisions of this decade.

The Quick-Fix Part of the COVID Recovery Is Behind Us

Record stimulus put a floor under the economy, household and corporate balance sheets healed quickly, and generous policy supports remained in place for an extended period. But the resultant inflation muddies the path toward economic growth. The next phase of the expansion will feature greater volatility and a chorus of rising risks. I am careful to separate the economy from market performance because the historic policy response provides a cushion to the economy even as higher rates challenge financial markets. Years of falling interest rates, low inflation and constant policy support provided a tailwind for non-diversifiable market risk, i.e., beta, but in my view, the reversal of these trends means that this tailwind is now a headwind for beta-reliant strategies. 

To counter the prevailing headwinds that are likely to challenge market returns, investors should consider the benefits of shorter-duration assets, industries with secular growth and thematic investing. Investors don’t have it easy in this environment, which is a vastly different one from that of the previous decade-plus. But they have options, if they dig into the fundamentals. 

With data and analysis by Taylor Becker.

1. Committee for a Responsible Federal Budget, as of 2/14/22.
2. Board of Governors of the Federal Reserve System, as of 2/16/22. 
3. Bureau of Labor Statistics and Bloomberg, as of 1/31/22. Based on the US CPI for Urban Consumers YoY and the 10-year Treasury yield.
4. Bloomberg, as of 2/18/22. Represents the price return for the IPOX SPAC Index, which is a benchmark for the performance of a broad universe of Special Purpose Acquisition Vehicles (SPACs). 
5. Morningstar and SIFMA, as of 1/31/22 (taxable bond funds) and 9/30/21 (municipal bonds). 
6. Bloomberg, as of 2/22/22. 
7. Bloomberg, as of 2/22/22.  
8. John Burns Real Estate Consulting, October 2016.
9. Census Bureau, HUD and Freddie Mac, as of 12/31/21 (home price) and 2/17/22 (mortgage rates).  Represents the Median Sales Price of Houses Sold for the United States, and the 30-Year Fixed Rate Mortgage Average in the United States.
10. Leading Builders’ “Residential Construction Economic Study”, as of 7/7/20. 
11. Treasury Department data, as of 12/31/21. 
12. Treasury Department data, as of 1/31/22. 
13.Treasury Department data for fiscal year 2021.

The views expressed in this commentary are the personal views of Joe Zidle and do not necessarily reflect the views of Blackstone Inc. (together with its affiliates, “Blackstone”). The views expressed reflect the current views of Joe Zidle as of the date hereof, and neither Joe Zidle or Blackstone undertake any responsibility to advise you of any changes in the views expressed herein.

Blackstone and others associated with it may have positions in and effect transactions in securities of companies mentioned or indirectly referenced in this commentary and may also perform or seek to perform services for those companies. Blackstone and others associated with it may also offer strategies to third parties for compensation within those asset classes mentioned or described in this commentary. Investment concepts mentioned in this commentary may be unsuitable for investors depending on their specific investment objectives and financial position.

Tax considerations, margin requirements, commissions and other transaction costs may significantly affect the economic consequences of any transaction concepts referenced in this commentary and should be reviewed carefully with one’s investment and tax advisors. All information in this commentary is believed to be reliable as of the date on which this commentary was issued, and has been obtained from public sources believed to be reliable. No representation or warranty, either express or implied, is provided in relation to the accuracy or completeness of the information contained herein.

This commentary does not constitute an offer to sell any securities or the solicitation of an offer to purchase any securities. This commentary discusses broad market, industry or sector trends, or other general economic, market or political conditions and has not been provided in a fiduciary capacity under ERISA and should not be construed as research, investment advice, or any investment recommendation. Past performance is not necessarily indicative of future performance.

For more information about how Blackstone collects, uses, stores and processes your personal information, please see our Privacy Policy here: www.blackstone.com/privacy.

Related Articles